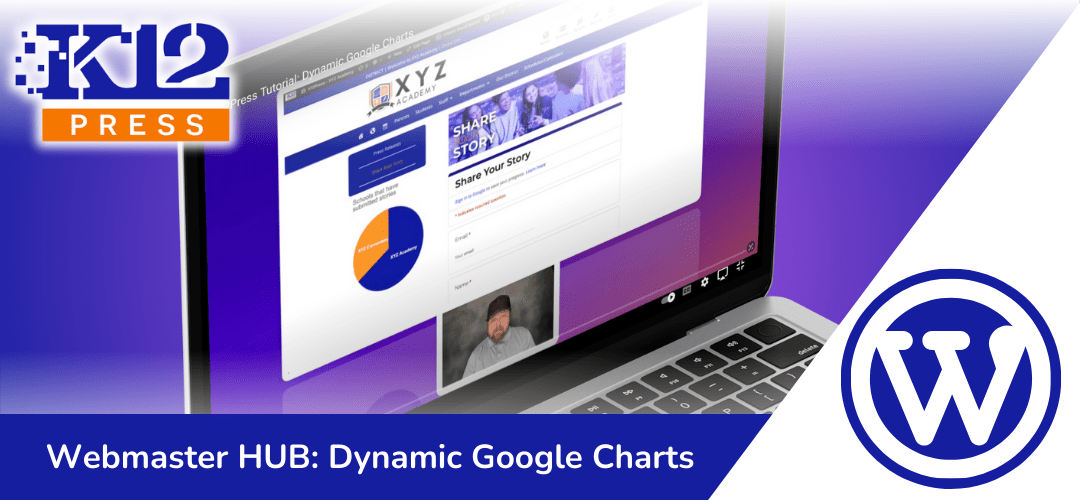
The way schools communicate and present information to their community is more important than ever. Recognizing this, K12Press has released a tutorial aimed at revolutionizing how educational websites utilize data visualization. Our tutorial video, “Embed Dynamic Google Charts into Your School Webpages,” is not just a tutorial; it’s a gateway to making your school’s digital presence more engaging, informative, and interactive.
The Power of Visualization
Data tells a story, and how that story is presented can significantly impact its effectiveness and reception. By integrating Google Charts with your school’s website, you can transform raw data into compelling visual narratives. Whether it’s showcasing student achievements, displaying survey results, or sharing performance metrics, dynamic charts can elevate the presentation, making it accessible and engaging for all viewers.
A Step-by-Step Guide
Our tutorial walks you through the entire process of embedding Google Charts into WordPress sites, specifically focusing on charts that are dynamically updated through form submissions. Imagine the possibilities: a “Share Your Story” form on your website allows students, parents, and staff to contribute their experiences. Each submission automatically updates a Google Sheet, which then dynamically alters the displayed chart on your website. This seamless integration not only saves time but also ensures that your data visualizations are always current and reflective of the latest submissions.
Customization and Flexibility
Google Charts offers a wide range of chart types and customization options, allowing you to tailor the visual representation to fit your website’s design and the data’s narrative. Whether you prefer bar graphs, line charts, pie charts, or more complex visualizations, Google Charts can accommodate your needs, ensuring your website remains visually cohesive and branded.
Sharing the Tools
Recognizing the potential impact of this integration for schools worldwide, we’re offering to share the “Share Your Story” Google Form template with anyone interested in implementing this on their site. If you wish to make a copy and customize it for your use, please don’t hesitate to reach out. Simply send an email to charles.caddell@k12press.com, and we’ll get you set up with the resources you need to bring your school’s data storytelling to the next level.
Conclusion
Data visualization is a powerful tool in the digital toolbox of educational institutions. By embedding dynamic Google Charts into your school’s web and form pages, you can enhance the way you present information, making it more engaging, accessible, and meaningful. We invite you to watch our tutorial and see for yourself how this integration can transform your school’s online presence.
For further assistance, resources, or to obtain a copy of the “Share Your Story” Google Form template, please reach out to us at charles.caddell@k12press.com. Let’s work together to make your school’s website a beacon of information and engagement.
Step by Step | Embed Dynamic Google Charts from "Share Your Story" Form Submissions
Step 1: Setting Up Your Google Form
- Create a “Share Your Story” Google Form. This form should be designed to collect stories, feedback, or data from students, teachers, and the school community. Ensure the form includes fields relevant to the data you wish to visualize.
Step 2: Linking Google Form to Google Sheets
- Once the form is set up, configure it to automatically populate responses into a Google Sheets spreadsheet. This link between your form and Google Sheets is crucial for dynamically updating the data in your chart.
Step 3: Creating a Google Chart
- In Google Sheets, select the range of data you want to visualize. Use the Google Sheets chart editor to create a chart that best represents your data. Customize the chart according to your preferences and the story you want the data to tell.
Step 4: Embedding the Chart into Your Website
- After finalizing your chart in Google Sheets, obtain the HTML embed code provided by Google Sheets. This code will allow you to insert the chart directly into your school’s webpages or form pages.
- Navigate to the WordPress page or post editor where you want to embed the chart. Insert the HTML code into a Custom HTML block or through your page builder’s equivalent HTML embedding feature.
Step 5: Ensuring Dynamic Updates
- Verify that the embedded Google Chart updates automatically whenever new form responses are submitted. This dynamic update feature is what makes your data visualization compelling and current.
Step 6: Sharing and Customization Offer
- Charles Caddell offers to share the Google Form with anyone interested in customizing it for their use. Viewers are encouraged to send an email to charles.caddell@k12press.com to request a copy of the form.


